| Master software performance in just 16 hours! Join our Software Optimization for the Memory Subsystem Workshop taking place from May 18th to May 21st. Click here to express interest or register. |
This is the third post in a series about loop optimizations. In the first post we talked about the most common optimizations compilers do, and in the second post we talked about the times you want to take compiler optimizations into your own hands, either by helping the compiler or doing them instead of the compiler.
In this post we talk about the compiler optimization report: a report generated by the compiler with information about the types of optimizations and the source code where they were made. We will show you how to generate the report, visualize it and how to interpret the report to make your program faster. The post has been conceived as a reference document, that you can consult in case you have performance issues in your code.
A note before start
Before we start, I need to point out an important thing. The original idea behind compiler optimization reports is debugging problems with the compiler and not optimizing code. Knowing this, a compiler optimization report is not a magic bullet that will make your program run faster quickly and easily. They are one of the tools you as a developer have at your disposal to speed up your code, but they won’t catch all the problems or propose all the ways to solve your performance headaches.
About compiler optimization reports
All the popular compilers have compiler switches that enable generation of optimization reports but optimization reports come with their own complexity. There are several reasons for that:
- Optimization reports are very complicated for an average developers. A lot of terminology revolves around the compiler’s intermediate representation, which can be unfamiliar to many software developers. Additionally, each optimization phase in the compiler has its own terminology. Most people are overwhelmed first time they see a compiler optimization report.
- Optimization reports are difficult to read. The output of the optimization report can be huge, which means navigating through it can be difficult. Additionally, you see the source code lines, but you don’t see the actual code, so figuring out the relevant lines is difficult. And lastly, there can be a lot of information that is not helpful at all.
- Each compiler has its own format of optimization report. So, for instance, CLANG’s optimization report can look very differently from the GCC’s optimization report for the same code.
- It is useful to know which optimizations the compiler did, but it is more useful to know which compiler optimizations the compiler didn’t do. Because the ones that it didn’t do are the ones that we can help with.
As far as (1), (3) and (4) are concerned, there is no easy way to work around them. To have full power over the compiler optimizations, you will need to understand what it is saying to you. As far as (2), in CLANG there is a way to visualize the compiler optimization report using a tool called opt-viewer.py. We will talk about it in the following sections.
Do you need to discuss a performance problem in your project? Or maybe you want a vectorization training for yourself or your team? Contact us
You can also subscribe to our mailing list (link top right of this page) or follow us on LinkedIn , Twitter or Mastodon and get notified as soon as new content becomes available.
How to profit from compiler optimization reports?
In my experience, you should inspect optimization reports from several compilers, not only one. You should inspect GCC’s optimization report, CLANG’s optimization reports and Intel classic compiler’s optimization report. If you are running on Windows, then MSVC’s compiler is also in the game. Intel’s classic compiler is very important because it generates very good optimization reports, especially related to vectorization. This compiler used to cost money, but now it is free and can be downloaded from Intel’s website as part of the Intel’s oneAPI HPC toolkit. Too bad it is scheduled to deprecate sometime in 2023.
How optimization passes in compiler work?
Optimizations in compiler are done in optimization passes. There are many optimization phases, and optimization phases typically run independent of each other. Each pass outputs its own optimization messages independently, but typically the compiler later groups them and sorts them by file and line number.
The compiler groups optimization messages into three groups: successfully applied, missed and notes (or remarks). Out of all the three, the most useful are messages from the missed group since this is where lies the optimization potential. Messages from the notes group are most of the time relevant for the compiler developers, and you can leave them off, at least in the beginning.
Compilation Flags
When investigating the compiler optimization report, it is important to compile the code with proper compiler optimization options. You should compile with the same optimization flags as you use for your production binary: -O2 or -O3 optimization level, and occasionally-ffast-math. Also, you should specify march=native or a corresponding flag to utilize all the possibilities of the CPU. Otherwise, the corresponding optimization passes will be disabled and the output will be empty.
How to generate compiler optimization reports?
Here are the exact compiler switched for the three most popular compilers: GCC and CLANG. For other compilers consult the documentation.
GCC
To get the complete GCC’s compiler optimization report, you will need to specify -fopt-info-all-optall in the GCC compilation line. We tested this option with GCC 8.5 on our test code and the report is here. As you can see, the output is huge, but upon further inspection, the only useful data we could extract from the report was about function inlining and loop vectorization.
If this is too much data for you, you can control the amount of information using compiler switches. Here is the link to the GCC documentation.
CLANG
Getting CLANG’s vectorization report is similar to GCC. You need to specify -Rpass-missed=.* -Rpass=.* -Rpass-analysis=.*. Again the output is huge, but compared to GCC’s report, it has more relevant information. In our example, it showed when the compiler did dead code elimination or loop invariant code motion. But this information was hidden in the sea of internal debug data.
Again, you can control the amount of information using compiler switches. Here is the link to the LLVM documentation on how to do it.
LLVM comes with this awesome tool called opt-viewer.py that helps you visualize the optimization report in the context of the source code. The tool is really good and user friendly, and we will dedicate the rest of this post to it.
MSVC
To generate the vectorization report for MSVC (Visual Studio C++ compiler), pass /Qvec-report:2 to the compiler.
Visualizing the compiler optimization report
Until this point, we gave general notes that apply to most compilers. From this point on, we talk only about understanding CLANG’s optimization report. We picked CLANG because it is the most common compiler nowadays, available for Windows, Linux, Mac and Android. It also produces a very decent optimization report. And of course, there is a visualizer which is very good (other compilers don’t have good visualization tools).
Below is the screenshot of the visualization for the test source file we use in this post. If you click on it, it will open an explorer window where you can explore the recommendations inside a web browser.

You can navigate your source code like in an IDE, and for each line there are optimization messages produced by various compilation phases of the compiler.
Producing the report
To produce the report, you need to pass -fsave-optimization-record to CLANG. After you compile your program with this switch, for each object file (e.g a.out) there will be a corresponding optimization report a.out.opt.yaml. This file is needed for the visualizer.
To visualize the report, you will need opt-viewer.py script, which on Linux is a part of llvm-12-tools package. Installing it is simply running sudo apt install llvm-12-tools. After installed, you run the script like this:
$ python3 /usr/lib/llvm-12/share/opt-viewer/opt-viewer.py my-optimization-report.opt.yamlThe script generates a html directory, and inside it there is a index.html file. You can open it from the command line:
$ open html/index.htmlAfter this modification, a web browser instance will open and you will be able to navigate the report.
Do you need to discuss a performance problem in your project? Or maybe you want a vectorization training for yourself or your team? Contact us
You can also subscribe to our mailing list (link top right of this page) or follow us on LinkedIn , Twitter or Mastodon and get notified as soon as new content becomes available.
Interpreting the report
Before starting to interpret the report, you should profile the code to see which function takes most of the runtime. It only makes sense to focus your attention there, since modification to this code will result in speed improvements. To illustrate the features of the compiler and the visualizer in the upcoming section, we use this source code, corresponding to this .yaml file and this HTML report.

Above is the optimization report. The window is split into four columns. The biggest is the Source column, in the middle of the screen, which gives the program’s source code interleaved with optimization remarks. On the left there is a Line column, which gives the source code line and Optimization which gives the name of the optimization pass that produced the remark. If the compiler inlined the code to some other function, you can see where it was inlined in Inline Context column on right.
Within the report, there are three types of messages:
- Green messages: optimizations performed successfully.
- Red messages: optimizations tried but failed (missed opportunities).
- White messages: general remarks.
When trying to speed up our code, we will mostly focus on missed optimization opportunities, as these are the places where the compiler has failed to do something that it could have done, and these are the places where you can actually help it.
Let’s observe how the messages relate to the source code. Here an example:

We added the shapes and arrows in red to simplify explaining. The optimization report first shows a source code line, and after that all the optimization remarks related to that line. Inside the optimization remarks you can often see hyperlinks, which when you click them will lead you to other lines of source code.
So, in the above example gvn compiler pass is saying “load (1) of type i32 not eliminated in favor of load (2) because it is clobbered by store (3)“. The load (1) is on line 207. The load (2) is also on line 207, which you can figure out by clicking the hyperlink. The store (3) is on line 208, also which you can observe by clicking the hyperlink.
This biggest flaw of opt-viewer.py is that it only shows the line number, and not the column number (position int he line). Consider the line 207. Inside it there is a load of 0 to i, there is a load of str value, load of str->n value and load of i in order to increment it. What load is the optimization remark actually referring to?
To answer this, you will need to lookup the associated .yaml file. Here is it for our case:

Here, beside line numbers, we can see the column numbers as well. There is an issue on LLVM bug tracker to add column numbers to opt-viewer.py; you can write a “Me too” comment to add this feature! Further in this post, we combine the visualized data with the column information from the .yaml file to get the most precise information.
A few additional notes
- If the compiler doesn’t report a missed optimization opportunity, that doesn’t mean that the optimization was done. It most likely mean that the compiler didn’t even try the optimization. So, the compiler optimization report doesn’t magically detect all missed optimizations, just some.
- In the optimization remark, you will often see
load,store,getelementptr,sextetc. These are the names of LLVM Intermediate Representation instructions. They have a correspondence in the source code, but it’s not always clear what e.g.getelementptractually refers to. Sometimes you will actually need to google the meaning of certain instruction to understand how it corresponds to your source code. - If the amount of information is too large or the scripts start running out of memory, there is an implementation of
opt-viewer.pymaintained by Ofek Shilon that is more user friendly: it ignores system headers, reports only missed optimization opportunities, etc. You can find the source code here.
Do you need to discuss a performance problem in your project? Or maybe you want a vectorization training for yourself or your team? Contact us
You can also subscribe to our mailing list (link top right of this page) or follow us on LinkedIn , Twitter or Mastodon and get notified as soon as new content becomes available.
Optimization Report on Compiler Explorer (godbolt.org)
Optimization report is available in compiler explorer. To enable it, first will need to select CLANG as your compiler. Do not forget to set up the correct compilation flags (e.g. -O3 -mavx). Click a small + sign, and select optimizations

The optimization report will appear. It looks a bit differently then the one produced here; if you hover your mouse you will see the tooltip with the optimization report for a given line. This includes column numbers, the things we were missing in the locally produced report!

Compiler Passes
Until this point we described how to produce the compiler optimization report and what are its essential parts. But the real value lies in the messages themselves. Because the messages provide the performance insights!
In CLANG compiler report, four modules will dominate the report: gvn, licm, inline and vectorizer. Occasionally you will see also modules: regalloc, loop-unroll, slp-vectorizer, etc. Here we go through the list of common modules, the messages they produce, and what can you do about them.
Pass: inline
Inline pass inlines functions. Inlining removed the price of a call and opens opportunity for additional compiler optimizations. As a rule of thumb, inlining pays off for functions with constant time complexity O(1), and doesn’t pay off in other cases (the price of call is too small to influence performance).
You can use the information from the inline pass to verify if the compiler has inlined a function. If inlining failed, most common reasons are:
| Reason | Meaning | Workaround |
|---|---|---|
| XXX will not be inlined into YYY because its definition is unavailable | Function body is not available to the compiler | Move the definition to a header OR enable link-time optimizations. If you use virtual functions, bear in mind they cannot be inlined. |
| XXX not inlined into YYY because too costly to inline | Function too big | Decrease the size of the function OR force inlining through attributes |
We wrote about inlining in a much larger extent in this blog post.
Pass: gvn – Global Value Numbering
Although GVN pass in the compiler does a lot more, all the remarks produced by this pass are related to redundant load elimination. To a certain extent this is understandable, because the biggest savings come from eliminating redundant loads.
Let’s explain what redundant loads are. Take the example bellow:
struct string {
    char* p;
    int n;
};

void test_pointeraliasing(string* str) {
    for (int i = 0; i < str->n; i++) {
        str->p[i] = '\0';
    }
}
Ideally, the compiler doesn’t need to reread value str->n from memory in each iteration. It also doesn’t need to reread the address of str->p in each iteration. These values can be stored in registers because they don’t change between iterations.
However, if between two loads of the same value something happens that could modify that value, the compiler informs us that the value is clobbered and that it needs to be reloaded from the memory.
Let’s look at the compiler optimization report for this code:
Take note of the gvn remark surrounded with the red rectangle. It says that load of n in str->n could not be eliminated in favor of load of n in str->n (same load in the previous iteration) because it is clobbered by store of '\0' to str->p[i].
This happens because of possible pointer aliasing. Potentially, someone could have initialized the string as: string *str; str->n = 5; str->c = &(str->n); and create a pointer aliasing, where modifying str->p[0] would result in str->n changing value.
The fix is relatively straightforward: copy the value of str->n to a local variable int n = str->n; and use n instead. Local variables cannot be aliased by other pointers. This is, however, not possible in all cases. Consider this example:
void test_distribution(int *a, int *b, int* c, int* e, int n) {
    for (int i = 0; i < n; i++) {
        a[i] = a[i - 1] * b[i];
        c[i] = a[i] + e[i];
    }
}
Here is the compiler’s optimization report for the above loop:

In the above optimization report, the compiler complains that load a[i - 1] is clobbered by store to c[i]. It also complains that load of e[i] is clobbered by store to a[i]. This could indeed happen if we call our function using test_distribution(a, b, a, b, n); . In this example, it would take too much time to copy some or all of the arrays to temporary arrays. If we know for sure that there is no pointer aliasing, we can mark the pointers that are never aliased by other pointers using the __restrict keyword, like this:
void test_distribution_fixed(int * __restrict a, int * __restrict b, int* __restrict c, int* __restrict e, int n) { ...This fixes the optimization remark.
Pass: licm – Loop Invariant Code Motion
Loop invariant code motion moves instructions that are loop invariant, i.e. instructions that always yields the same result in each iteration of the loop, outside of the loop. This decreases the amount of work that needs to be done in the loop, and consequentially, increases performance.
There are two operations this pass does: hoisting, which means moving the loop invariant operation before the loop and sinking, which means moving the loop invariant operation after the loop. Most operations that are loop invariant are hoisted, only stores are sinked.
Here is an example of a loop that profits a lot from LICM:
void test_licm(double* a, double* b, double* c, int n) {
for (int i = 0; i < n; i++) {
for (int j = 0; j < n; j++) {
for (int k = 0; k < n; k++) {
c[i * n + j] += a[i * n + k] * b[k * n + j];
}
}
}
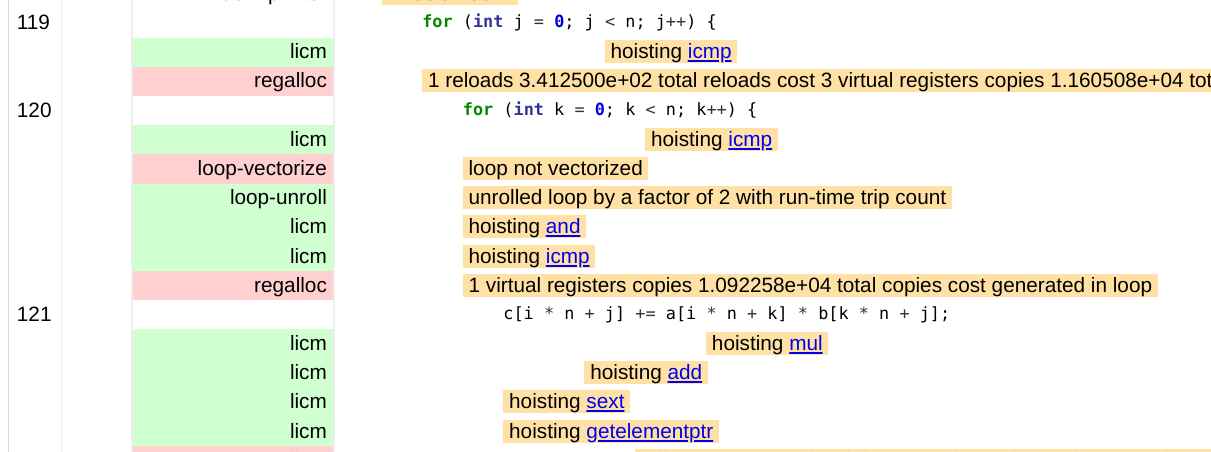
}Before continuing, notice that LICM always works on the level of LLVM instructions. Here is the compiler optimization report for this loop:

You can see that LICM has hoisted many LLVM instructions outside of the loop: mul, add, sext and getelementptr. But it has failed to move load with loop-invariant address, probably due to pointer aliasing. The load we are talking about is load of c[i * n + j] which is implicit in the += operator.
To fix this issue, you apply the same workaround as for GVN. In this case we introduce a new variable tmp to store the value. Here is the source code:
void test_licm_fixed(double* a, double* b, double* c, int n) {
    for (int i = 0; i < n; i++) {
        for (int j = 0; j < n; j++) {
            auto tmp = c[i * n + j];
            for (int k = 0; k < n; k++) {
                tmp += a[i * n + k] * b[k * n + j];
            }
            c[i * n + j] = tmp;
        }
    }
}
In the case of LICM, fixing the issues runs along very similar lines as GVN pass: either introduce a temporary variable to hold the value of a loop invariant expression, or use __restrict keyword to restrict the pointer.
Do you need to discuss a performance problem in your project? Or maybe you want a vectorization training for yourself or your team? Contact us
You can also subscribe to our mailing list (link top right of this page) or follow us on LinkedIn , Twitter or Mastodon and get notified as soon as new content becomes available.
Pass: loop-vectorize
Loop vectorize pass will tell you if the loop is vectorized. We talked about vectorization here and here, so if you are unfamiliar with it, read that first. Vectorization is important if you strive for top performance, but notice that many codes cannot be vectorized.
One of the biggest problems of this pass is that it doesn’t specify the line:column of the source code that inhibits vectorization. Therefore, you will need a deeper understanding of vectorizer limits in order to fix the issue.
Here we will give a few examples of vectorization problems, that cover most of the problems with vectorization, and ways to solve them:
Cost Model
The compiler vectorizer has a cost model, which will calculate if vectorization pays off or not. Typically, two things make vectorization inefficient and therefore the compiler omits it: non-sequential memory accesses and too many conditionals in the loop body.
Here is an example of the loop with non-sequential memory accesses:
void test_interchange(int* a, int* b, int n) {
    for (int i = 1; i < n; i++) {
        for (int j = 0; j < n; j++) {
            b[j * n + i] = a[j * n + i] - a[(j - 1)* n + i];
        }
    }
}
All three memory accesses, b[j * n + i], a[j * n + i] and a[(j - 1)* n + i] are non sequential. The compiler optimization pass loop-vectorize reports an error:
the cost-model indicates that vectorization is not beneficial
In this case, it is possible to get rid off non-sequential memory accesses through loop interchange. By making the inner loop over i and the outer loop over j, the memory access pattern for all three variables becomes sequential and vectorization is possible. Notice, however, that many times fixing bad memory access pattern is not possible (notably loops that work with larger structs or classes).
Another reason why this message may appear is that there are conditionally executed statements inside the loop body. Consider the example:
void test_gvn(int* a, int* b, int n) {
    for (int i = 0; i < n; i++) {
        if (a[i+1] > 0) {
            b[i]++;
            a[i+1]++;
        }
    }
}
In this case, the compiler prints the same error message and vectorization doesn’t take place.
In the case of conditional statements, sometimes you can get rid of them if they are doing non-essential processing, as already explained in the first post. But generally, if the conditional processing depends on the data, it cannot be removed.
You can force the compiler to override its cost model and vectorize the loop regardless using compiler pragmas. The portable version are OpenMP SIMD pragma #pragma omp simd1, but CLANG also has its own pragma #pragma clang loop vectorize(enable)). Bear in mind that forcing vectorization only occasionally makes a performance difference.
Loop-carried dependencies
Loop-carried dependencies prevent vectorization. Actually, loop-carried dependencies prevent any kind of parallelization. Here is an example loop that partitions an array v into two parts, left part smaller than pivot and right part larger than pivot:
for (int j = 0; j < n; j++) {
    if (v[j] <= pivot) {
        i++;
        std::swap(v[i], v[j]);
    }
}
The value of i in the current iteration depends on the value of i from the previous iteration. This kind of code is not automatically vectorizable by the compiler. The error produced is:
loop not vectorized: value that could not be identified as reduction is used outside the loop
It is possible to vectorize this code, but vectorization needs to be done manually using a trick.
Here is another example of a loop with loop-carried dependency with a slightly different optimization missed message:
for (int i = 0; i < n; i++) {
    a[i] = a[i - 1] * b[i];
    c[i] = a[i] + e[i];
}
In this case, calculating the value of a[i] requires a value a[i - 1], which is a loop-carried dependency. The error message is like this:
loop not vectorized: unsafe dependent memory operations in loop. Use #pragma loop distribute(enable) to allow loop distribution to attempt to isolate the offending operations into a separate loop
Here, the term dependent memory operations refers to the loop-carried dependencies. The compiler also suggest to split the loop into two loops using a compiler pragma (distribute loop), but it is better to do it manually:
for (int i = 0; i < n; i++) {
    a[i] = a[i - 1] * b[i];
}
for (int i = 0; i < n; i++) {
    c[i] = a[i] + e[i];
}
In this case, the first loop will remain unvectorized because of loop-carried dependencies. But the second loop will be vectorized, which has a potential to improve the overall speed.
Do you need to discuss a performance problem in your project? Or maybe you want a vectorization training for yourself or your team? Contact us
You can also subscribe to our mailing list (link top right of this page) or follow us on LinkedIn , Twitter or Mastodon and get notified as soon as new content becomes available.
Pointer Aliasing
Pointer aliasing happens when two different pointers point to the same memory block. When pointer aliasing is present, vectorization is not possible because pointer aliasing creates loop-carried dependencies. The good thing about pointer aliasing is that it happens rarely in practice, because most developers don’t program that way. The bad thing is that compilers often have to omit vectorization because of it, so looking at the optimization report pays off.
Here is an example where apparent pointer aliasing prevents vectorization:
void test_spilling(int* a, int* b, int* c, int *x, int* y, int* z, int n) {
    for (int i = 0; i< n; i++) {
        a[i] = a[i] + i;
        b[i] = b[i] + i;
        c[i] = c[i] + i;
        x[i] = x[i] + i;
        y[i] = y[i] + i;
        z[i] = z[i] + i;
  }
}
The compiler usually emits a runtime pointer aliasing check, where it dispatches to a vectorized or non-vectorized version of the code depending on the result of the analysis. But in this case, there were too many pointers to check, and since each pointer has to be checked against each other, the number of checks was too large so the compiler emitted the following error:
loop not vectorized: cannot prove it is safe to reorder memory operations
In this case, using __restrict keyword on the pointers that are guaranteed to be independent or an explicit vectorization pragma (see cost-model) will help vectorize the loop. Of course, if you apply these techniques, but you code happens to have a true pointer aliasing, the produced results can be wrong.
Another example of vectorization failure due to pointer aliasing is this:
void test_loop_unrolling(int* a, int * b, int n) {
    for (int i = 0; i < n; i++) {
        a[i] = b[i/2];
    }
}
The hot loop has two pointers, but the compiler cannot emit pointer aliasing check because it cannot figure out the length of all the arrays in the loop. The length of array a is n, and the length of the array b is n/2, but the compiler cannot figure this out. Therefore, the compiler produces the following message:
loop not vectorized: cannot identify array bounds
This is a limitation of the compiler, so it usually is enough to rewrite the loop so that it is easier for the compiler to infer the missing information. Here is one example on how to do it:
void test_loop_unrolling_fixed(int* a, int * b, int n) {
    for (int i = 0; i < n/2; i++) {
        a[2 * i] = b[i];
        a[2 * i+1] = b[i];
    }
}
Uncountable Loops
For vectorization to take place, the loop needs to be countable. A loop is countable if the number of iterations can be calculated before the loop starts. Most for loops are countable; also some while and do while loops are countable as well. An example of a countable loop is memcpy implementation. An example of an uncountable loop is a search loop; it is uncountable because we cannot say how many iterations will the loop have before it starts.
Here is an example of a loop with this message:
void test_pointeraliasing(string* str) {
    for (int i = 0; i < str->n; i++) {
        str->p[i] = '\0';
    }
}
The same loop was used to illustrate the GVN pass. The compiler cannot vectorize this loop because str->n is not a constant. And the reason why str->n is not a constant is as already explained: writing to str->p[i] could change its value because of the pointer aliasing. The compiler emits a message:
loop not vectorized: could not determine number of loop iterations
In this case, the solution is simple. Copy str->n to a local variable that is certainly not aliased. But generally, when you have true uncountable loops, the solution is applying loop section on them.
Call to a function in the loop body
If the loop body contains a call to a function, then it cannot be vectorized, unless the call is inlined or the function itself is a vector function. Here is an example of a loop that cannot be vectorized:
for (int i = 0; i < n; i++) {
    if (a[i] != 0) {
        if (debug) {
            log_error("error");
        }
        error_cnt++;
    }
}
Inside the loop, there is a call to log_error function. The compiler emits the following message:
loop not vectorized: instruction cannot be vectorized
If it is possible to remove the call, or to inline it, then the loop would be vectorizable. In this case, since debug is constant during the execution of the loop, the loop can be unswitched and the version without a call to log_error can be vectorized.
IEEE 754 Floating Point Conformity
When you are developing software, ideally you want the same results for same input data on all the systems and all compilers. For floating-point types, this is made by compiler following IEEE 754 standard. According to this standard, floating-point operations are not associative, i.e. (a + b) + c is not necessarily equal to a + (b + c).
For vectorization, in case of reductions, the compiler needs to change the order of calculations in order to enable vectorization. Here is the example of an unvectorizable loop:
double test_vectorization_reduction(double* a, int n) {
    double sum = 0;
    for (int i = 0; i < n; i++) {
        sum += a[i];
    }

    return sum;
}
Vectorizing this loop would result in different results, so the compiler omits it. The reported warning was this:
loop not vectorized: cannot prove it is safe to reorder floating-point operations
There are a few ways to deal with it:
- Explicit vectorization pragma (see cost model). The results will be different.
- Relaxing IEEE 754 conformity through compiler switches (in this case
-fassociative-mathor-ffast-math). The results will be different, especially with-ffast-math. - Extracting the reduction part into a separate loop. If the loop has a lot of computations and a reduction, splitting the loop into two parts, one with computations without reduction and one with reduction will help speed up the program. The reduction loop still remains unvectorized. This will not effect the result precision.
Applying an explicit vectorization pragma helped fix this issue.
Additional Notes
Large complex loops may not vectorize for a variety of reasons simultaneously, which might not be clear from the report. In this case, splitting the loop into smaller parts, working them part by part, and then joining them back together should be a reasonable approach.
Do you need to discuss a performance problem in your project? Or maybe you want a vectorization training for yourself or your team? Contact us
You can also subscribe to our mailing list (link top right of this page) or follow us on LinkedIn , Twitter or Mastodon and get notified as soon as new content becomes available.
Other Passes
Apart from these passes, there are also a few other that appear in the optimization report, but whose impact on performance is smaller or they occur more rarely:
- regalloc – translates virtual registers to hardware registers. Since the number of hardware registers is limited, the pass might need to move some values from the registers to the stack in the process of spilling. Later, it reloads the values from the stack to the memory in the process of reloading. If optimization report indicates register spilling, check out these tips on how to fix it.
- loop-unroll – controls loop unrolling. You can use
pragma clang loop unroll(...)option to control it. - loop-delete – deletes invariant loops, or loops that can be evaluated at compile time.
- loop-idiom – converts special types of loops to more efficient version. For example, converts a memset loop to a call to memset function.
- slp-vectorizer – combines similar independent instructions into vector instructions. More info here.
Final Words
My general opinion is that the CLANG’s optimization report is not as useful as I hoped it would be. The basic optimization information are there, like avoiding duplicate work and vectorization, but apart from that, many more are missing.
Other compilers (notably Intel Classic C++ compiler) have better optimization reports, where they can propose loop interchange, loop tiling or loop fusion. So, running your code through another compiler and investigating that optimization report might be a good idea.
You should use compiler optimization report as one of the tools in your tool box to speed up your program. But, it is not a magic bullet, and you should use other tools as well. You should also try other optimization techniques, that we explained in the previous post, which compiler might have completely omitted.
Do you need to discuss a performance problem in your project? Or maybe you want a vectorization training for yourself or your team? Contact us
You can also subscribe to our mailing list (link top right of this page) or follow us on LinkedIn , Twitter or Mastodon and get notified as soon as new content becomes available.
- You need to forward the compiler flag
-fopenmpor-fopenmp-simdfor this flag to work [↩]
Wow, this is incredible, thanks for such a helpful post. All of this information could be found individually (the compiler flags, the Intel docs etc) but collating it all together like this and putting screenshots and explanations is such a huge help.
Thanks a ton!
Hey – thanks for the mention (and the great post). 2 minor additions: (1) My version of opt-viewer.py does display column info for the remark, not just line number. (2) Today compiler-explorer also displays optimization remarks with column info (and that was a PR by me too).
It’s worth mentioning that compiler-explorer is much easier to work with for exploring and interacting with small code snippets.
Awesome! I will update that as soon as I have a bit time!
When you say compiler explorer, you mean godbolt?
Yes
Excellent post!
Never heard of opt-viewer.py although I’ve used LLVM for years, I’ll have a try to check my optimization results.