| Master software performance in just 16 hours! Join our Software Optimization for the Memory Subsystem Workshop taking place from May 18th to May 21st. Click here to express interest or register. |
Summary: Profile guided optimizations are a compiler-supported optimization technique that is easy to use and will make your program run faster with little effort. Here you will learn how to enable it on your project and what kind of improvements you can expect.
One way of optimizing your program is to know your data. For example, in your switch clause, if you know one value appears much often than the other, you can give it a special treatment: move it before the switch case, like this:
if (x == 0) {
   function_0();
} else {
    switch(x) {
        case 1: function_1(); break;
        case 2: function_2(); break;
        ....
    }
}
In the above example, if value 0 appears much more often than other values, the above code will be on average faster. However, if the assumption is false, the resulting code will be slower.
This approach of modifying your code to match your data is called data-driven tuning. Although it has its place under the sun, the resulting code can be quite messy. Also, some assumptions about your code will change over time. Something that was valid five years ago isn’t necessarily valid anymore. And when assumptions are wrong it will be difficult to find places that are slowing down your program.
Luckily, there is a way to tune your program’s performance without this nasty code inside your code-base. Allow me to introduce:
Profile Guided Optimizations
Profile Guided Optimizations (PGO) is a technique that exists for several years in all major compilers. For the unfamiliar, profiling means collecting data about which functions and statements your program executes. The point is to find information about which code is hot and worth optimizing, and the optimization can be done either manually or automatically.
PGO is straightforward: collect the profile information of your program, then recompile it again by feeding the compiler with the profiling info. The compiler uses this information to generate a faster binary.
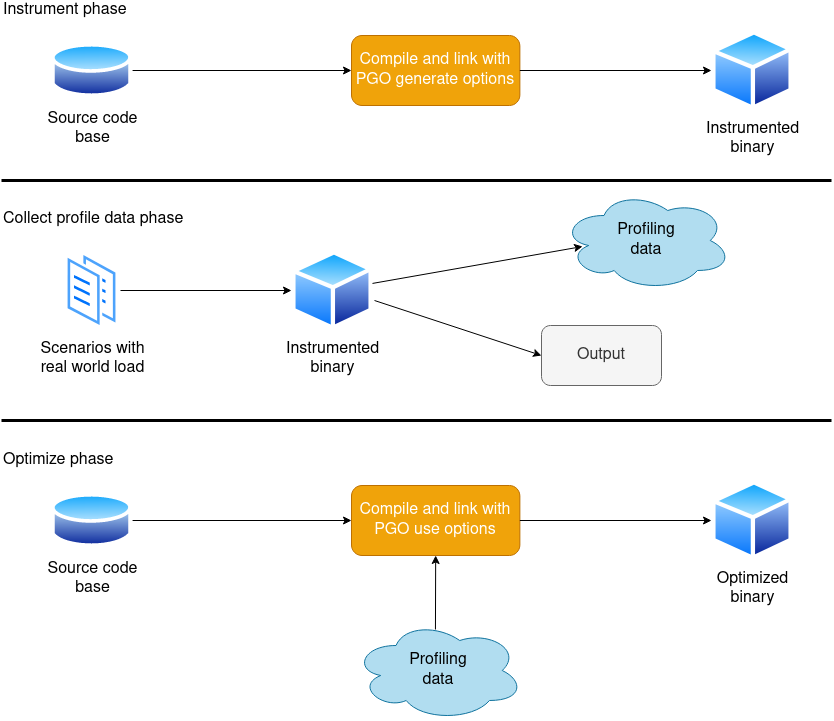
You can see how PGO woks in the above image. In details:
- In the instrument phase, you compile your program with PGO-generate options. The produced binary is instrumented in a special way to generate profile information.
- In the collect profile data phase, you should run your binary with realistic input data. It is important to use realistic input, bad input can make your program run slower!
- As a result of the previous step, binary creates a file with profile information. It records all function calls, executed for loops, if statements etc. Everything your program was doing is recorded there.
- In the optimize phase, you recompile your program with PGO-use options. The compiler uses the profile information file from the previous step during compilation to create an optimized binary.
This workflow has several advantages over manual tuning: code remains readable and maintainable; also if the assumptions are incorrect, it is much easier to replace the data for the input than it is to modify the source code. However, the two compile-test-recompile protocol is a bit complicated to set up.
There are several ways to collect profile information. The most common is for the compiler to instrument the source code. The other, not supported by all compilers but supported by CLANG, is to collect the profile information on a regular, non-instrumented binary using a standalone profiler (perf for example).
For your PGO build you will want to enable link-time optimizations (LTO). I wrote about it in the previous post, in case you are unfamiliar with them, they will allow inlining and other optimizations between different compilation units. PGO will really benefit from this.
And lastly, it is worth mentioning that there is a danger of overfitting. If your PGO input data is not a good representative of the real world load, your program will run fast on the PGO input data but not in real life. A wise selection of PGO input data is crucial!
Do you need to discuss a performance problem in your project? Or maybe you want a vectorization training for yourself or your team? Contact us
You can also subscribe to our mailing list (link top right of this page) or follow us on LinkedIn , Twitter or Mastodon and get notified as soon as new content becomes available.
Inside PGO (the entrails)
What kind of optimizations does PGO make? That depends on the compiler, but here is the list of the most important:
| Name | What it is? | How does PGO use it? |
|---|---|---|
| Function Inlining | Body of short, frequently used function gets copied to the place of the call instead of calling the function. This saves some time and enables additional optimizations. | Using PGO, the compiler can make a better choice on which functions to inline. It can skip inlining rarely called functions even if they are small. This increases the code locality and speed. |
| Basic block reordering | Fall-though branches are cheaper than branches taken. But the probability of branch condition is often not known at compile time. | The compiler knows which branches are taken by looking at the profiling data, and can make the optimal layout. |
| Register allocations | Often used variables should be kept in registers, but it is not always clear to the compiler which variables are used often. | Profile data will help the compiler figure out which variables are better kept in registers. |
| Grouping together functions that are used together | Functions call one another should be close to one another in memory. This makes the calls faster due to decreased number of instruction cache misses and TLB misses. It also results in a smaller number of accesses to the hard disk. | The compiler can deduce the functions that are executed often and lay them out close in memory. Functions that are rarely used will be moved to a special cold section. |
Rearranging if statements | In case of if statements, the compiler will evaluate the conditions as they are written. | The compiler can evaluate conditions in different order1 in order to evaluate first those conditions that have higher probability of being true. |
| Loop unrolling | Loop unrolling speeds up looping because the number of checks is reduced. But aggressive loop unrolling increases code size. | Compiler decide better and unroll only loops that are actually used. Rarely used loops will not be unrolled to save memory. |
| Loop unswitching | Loop unswitching removes invariant condition check from inside the loop and creates two copies of the loop: one where the condition is true, the other where it is false. However, this technique increases the binary size so the compilers use it sparingly. | Compiler can perform aggressive loop unswitching on hot loops which increases speed. |
This is not the complete list. Microsoft has a list of profile guided optimizations their compiler is using, it is worth having a look.
Just as a note, most of the optimizations revolve around a hot path: a hot path is a sequence of instructions that executes often. The compiler tries to remove everything away from the hot path and make the hot path as fast and as compact as possible. Non-hot code will be optimized for code size.
Usage
I will give the explanation here for CLANG. Other compilers use the same or similar options, it shouldn’t be a problem to google this for your specific compiler. There is also a possibility to collect profiling information using a profiler, like perf. Read more in CLANG’s documentation.
To compile your program to generate PGO data, you need to specify the command-line option -fprofile-instr-generate to CLANG. I was using CMAKE so in my case the command line looked like this:
$ cmake -DCMAKE_C_COMPILER=/usr/bin/clang -DCMAKE_CXX_COMPILER=/usr/bin/clang++ -DCMAKE_C_FLAGS="-O3 -fprofile-instr-generate -flto" -DCMAKE_CXX_FLAGS="-O3 -fprofile-instr-generate -flto" -DCMAKE_EXE_LINKER_FLAGS="-fuse-ld=lld" ../test-suite/I omitted a part of the command line for brevity. When the compilation is done, you will need to tell the produced binary the name of the file where you want to keep your profile data before you start generating profile data. This is done using an environment variable:
$ export LLVM_PROFILE_FILE=profile.outAfter having exported the environment variable like this, next time you run your binary it will save the profile data in a file called profile.out. You can generate several profiles for different loads and save each of them in a separate file.
The next step is to merge all your profiling output files in a single file. For this you use llvm-profdata utility, like this:
$ llvm-profdata merge -o fd.profdata profile.outNext, you need to compile your program again, but this time feeding the compiler with the profiling data. This is done by specifying -fprofile-instr-use=<filename> in the CLANG command line:
$ cmake -DCMAKE_C_COMPILER=/usr/bin/clang -DCMAKE_CXX_COMPILER=/usr/bin/clang++ -DCMAKE_C_FLAGS="-O3 -march=core-avx2 -flto -fprofile-instr-use=fd.profdata" -DCMAKE_CXX_FLAGS="-O3 -march=core-avx2 -flto -fprofile-instr-use=fd.profdata" -DCMAKE_EXE_LINKER_FLAGS="-fuse-ld=lld" ../test-suite/That’s it. The produced binary should run faster than the original.
This workflow is easy to set up as a part of a continuous integration system. If you are deploying source code instead of a binary, you could ship the profile database as a file in order to allow the customer to benefit from PGO without the need to do the profiling.
The speedups
In theory sounds simple, right? But how does PGO work in practice? On his blog, Denis Bakhvalov from easyperf.net organized a competition in manual data-driven tuning. The assignment was like this: optimize the LUA interpreter from LLVM test-suite on a range of tests LUA people use for benchmarking. It is a convenient real-world project to try PGO. Here are the results:
| Test | Baseline | PGO | Speed difference |
|---|---|---|---|
| ackermann | 0.88 s | 0.83 s | +6.0 % |
| ary | 0.5 s | 0.44 s | +13.6 % |
| binarytrees | 0.7 s | 0.66 s | +6.1 % |
| chameneos | 0.52 s | 0.46 s | +13.0 % |
| except | 0.7 s | 0.67 s | +4.5 % |
| fannkuch | 0.7 s | 0.61 s | +14.8 % |
| fibo | 0.46 s | 0.42 s | +9.5 % |
| harmonic | 0.43 s | 0.45 s | -4.4 % |
| hash | 0.51 s | 0.5 s | +2.0 % |
| hash2 | 0.45 s | 0.44 s | +2.3 % |
| heapsort | 0.51 s | 0.48 s | +6.3 % |
| knucleotide | 0.3 s | 0.28 s | +7.1 % |
| lists | 0.52 s | 0.45 s | +15.6 % |
| matrix | 0.54 s | 0.49 s | +10.2 % |
| meteor | 2.02 s | 2.16 s | -6.5 % |
| methcall | 0.58 s | 0.54 s | +7.4 % |
| moments | 0.48 s | 0.42 s | +14.3 % |
| nbody | 0.58 s | 0.52 s | +11.5 % |
| nestedloop | 0.42 s | 0.43 s | -2.3 % |
| nsieve | 0.46 s | 0.43 s | +7.0 % |
| nsievebits | 0.59 s | 0.57 s | +3.5 % |
| objinst | 0.55 s | 0.51 s | +7.8 % |
| partialsums | 0.37 s | 0.36 s | +2.8 % |
| prodcons | 0.44 s | 0.39 s | +12.8 % |
| random | 0.37 s | 0.38 s | -2.6 % |
| recursive | 0.65 s | 0.58 s | +12.1 % |
| regexdna | 0.81 s | 0.58 s | +39.7 % |
| regexmatch | 0.13 s | 0.13 s | +0.0 % |
| revcomp | 0.19 s | 0.18 s | +5.6 % |
| reversefile | 0.26 s | 0.24 s | +8.3 % |
| sieve | 0.48 s | 0.42 s | +14.3 % |
| spectralnorm | 0.54 s | 0.52 s | +3.8 % |
| spellcheck | 0.37 s | 0.36 s | +2.8 % |
| strcat | 0.44s | 0.41 s | +7.3 % |
| sumcol | 0.53s | 0.5 s | +6.0 % |
| takfp | 0.21 s | 0.2 s | +5.0 % |
| wc | 0.61 s | 0.51 s | +19.6 % |
| wordfreq | 0.35 s | 0.34 s | +2.9 % |
| SUM | 20.15 s | 18.86 s | +6.8 % |
Regular build took 20.15 seconds to finish all the test, the PGO build was 6.8%. The average for the speed difference is 7.6% and the standard deviation is 1.2. Small deviation tells us that most tests are around 7.6% faster than the regular build. But if you observe the table closely, some tests are way faster (39.7% for regexdna) and some of them are a bit slower (-6.5% for meteor).
We read that Chrome built with PGO is around 7.3 % more responsive on Windows and Firefox is 5 % faster. Python interpreter built using PGO is up to 10% faster on CPU bound Python programs when compiled with PGO.
Final Words
Profile guided optimizations will not reinvent your codebase, but they will make your program run a few percent faster with very little brain investment. You can expect a speed improvement between 5% and 10%. It will not make badly written programs run miraculously fast, but sometimes this performance difference is what is needed to meet the project requirements.
Do you need to discuss a performance problem in your project? Or maybe you want a vectorization training for yourself or your team? Contact us
You can also subscribe to our mailing list (link top right of this page) or follow us on LinkedIn , Twitter or Mastodon and get notified as soon as new content becomes available.
- If the conditions are without side effects [↩]