We talk about LIKWID and likwid-perfctr, a tool that you can use to get information from the hardware performance counters in a user-friendly way.
All posts tagged linux
Debugging performance issues in kernel space: system calls
We talk about how to detect if your program is spending a lot of time in kernel mode (system mode) and investigate ways to speed them up.

Speedscope: visualize what your program is doing and where it is spending time
In this post we introduce Speescope, a useful tool to help you visualize what your program is doing and where it is spending time.

RR: The magic of record and replay debugging
Learn about RR, a tool that will change the way you debug. RR will allow you to record bugs once and replay them anywhere. It will also allow you to reverse-execute your program, a feature that will simplify your debugging and your life.

The price of dynamic memory: Allocation
We talk about how to speed up your program if your program is taking time to allocate or release memory.
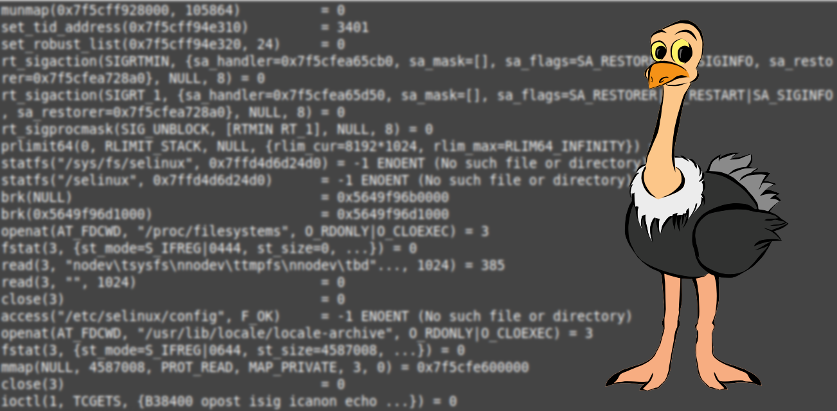
Lessons in debugging: observe how programs interact with the Linux kernel with STRACE
There are a subset of problems in software development that can be traced back to system calls or signals. Learn about STRACE, tool that let you trace system calls and signals and that can help you quickly figure out the origin of those problems.

CPU Dispatching: Make your code both portable and fast
CPU dispatchingh is all about making your code portable and fast. We will talk about how to make your detect features your CPU has at is disposal and select the fastest function for that particular CPU without a need to recompile your software.
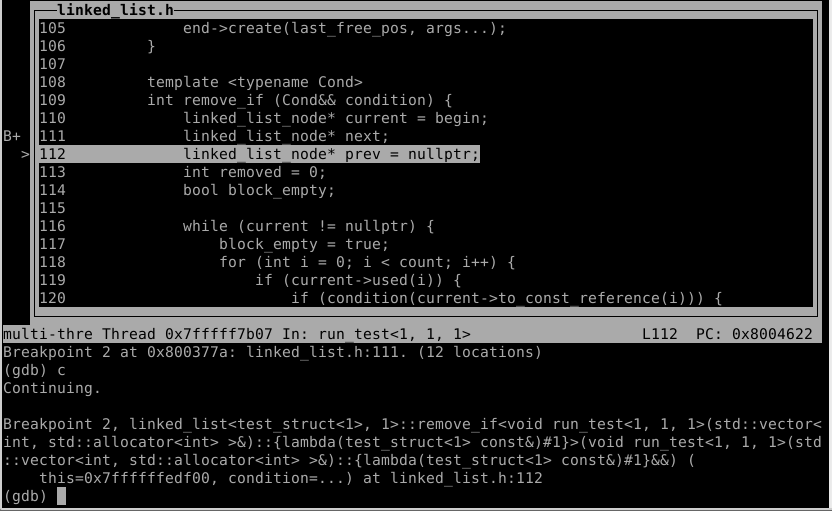
GDB: A quick guide to make your debugging easier
We will talk about how to profit from some of GDB’s very useful albeit less known features.