| Master software performance in just 16 hours! Join our Software Optimization for the Memory Subsystem Workshop taking place from May 18th to May 21st. Click here to express interest or register. |
Every now and then there is a need for us developers to understand what our programs are doing and where they are spending precious CPU cycles. First thing that comes to mind are profilers. For those who don’t know, profilers are tools that record the execution of your program and can tell you which functions are executing and how much time do they take.
Profilers are excellent tools when it comes to collecting data, but as far as presentation is concerned, often they are severely lacking. They present data as an endless tables with numbers and it is really hard to pick up what is actually going on. In this article I will write about FlameGraphs, a tool that I find immensely useful to help you get through this mess and give you the actual picture of what’s going on. But before that, let’s talk a bit about profilers:
Short introduction: Profilers
If you are familiar how profilers work you can skip this section. As we said, profilers are tools that collect data about your program execution. Here I am going to explain how sampling profilers work since we need this knowledge later.
When you run your program using a sampling profiler, your program is running as normal but at the same time the profiler is interrupting it several times a second, and every time it does that it takes a sample of the stack backtrace. When the program finishes execution, the profiler takes this raw data and makes a summary by observing the frequency of the calls. It can tell you which functions were executing and how much time did they take.
As an example, imagine a program that has functions A(), B() and C(). Function A() does something then calls function B(). Function B() does something then calls function C(). Let’s say your program was running for some time and profiler took ten samples. In the first three samples call stack had A()->B(), next five samples had A()->B()->C() and last two samples had A()->B(). With this information we know the function C() was doing most of the work since it appeared to be the last function in the call stack for five samples. Function A() was probably not doing anything smart, it was just calling B().
Now back to the topic:
FlameGraphs
From the site of FlameGraph project: Flame graphs are a visualization of profiled software, allowing the most frequent code-paths to be identified quickly and accurately. This definition is completely correct, but it is not quite clear how do flame graphs actually achieve this. Let us go with an example first.
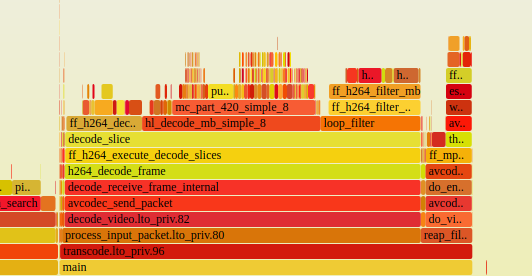
I was debugging ffmpeg1 and I wanted to see how ffmpeg was spending time while doing conversion from .ts to .mkv video format. To check this I ran ffmpeg through perf profiler to generate the profile data, and later I used FlameGraphs to visualize the data. Here is the output produced by FlameGraphs:

If the above image is too small click here to open a larger version. This is the graphical representation of what ffmpeg was doing during the file conversion.
If you pick a point on X axis and analyse the graph from bottom to the top (Y-axis), you see the stack backtrace. You can see for instance stack backtrace thread_worker->worker_func->estimate_motion_thread->ff_estimate_p_frame_motion->ff_epzs_motion_search. The lowest function is on stack level 0 and as you go up the stack level rises.
If you analyse the graph from left to right (X-axis), you will NOT see time. When I first saw FlameGraphs I though that X axis represents time, but it doesn’t. It would be really cool to generate flame graphs based on time since they can be used to better understand what your program is doing. I found a tool called speedoscope that can do that, I will need to investigate and write about it later if it’s good.
Stack traces on the X axis (left to right) are sorted alphabetically. The good thing about this approach is that it allows you to see which functions are using a lot of time, since the stack frames on level N from two different samples are merged together if all the functions up to N are same in both samples.
So, if you look closely in our example you will see that ffmpe most of its time spend in a handful of functions. You can see for example estimate_motion_thread called ff_estimate_p_frame_motion without doing almost anything, or that mc_part_420_simple_8 called several smaller functions during its runtime.
More information on how to analyze FrameGraphs can be found here.
A few more words on FlameGraphs
FlameGraphs is a collection of Perl scripts that take the output of a profiler and display it visually. FlameGraphs can use output of several different profilers:
- Linux: perf, eBPF, SystemTap, and ktap
- Solaris, illumos, FreeBSD: DTrace
- Mac OS X: DTrace and Instruments
- Windows: Xperf.exe
This makes it usable in almost all operating systems and languages.
FlameGraphs can visualize several different types of data:
- CPU: Tells you where your program is spending CPU cycles
- Memory: Display as a graph when memory is allocated in your programs, who does the allocation and how much memory is allocated
- Off-CPU: Tells you where your program is spending time when not doing CPU work, but waiting on I/O, locks, timers, paging/swapping etc.
- Hot/Cold: This is a combined graph that displays both CPU and off-CPU time spending
- Differential: Graphs that help you identify places where you introduced performance regressions
Some other time I will write more about other types of Flame Graphs. For this article I am focusing only on CPU graphs as these are used most frequently.
Flame Graphs Quickstart
Complete instructions are available on the Flame Graphs web site. Here we will show you how to generate Flame Graphs using perf profiler on Linux. You can generate them on other operating systems as well (check out Flame Graphs web site).
First you need to clone Flame Graphs from github:
git clone https://github.com/brendangregg/FlameGraphThis command should create FlameGraph folder. Next you need to use perf to record the profiling information for your program. If your program runs like ./my_prog arg1 arg2, run it like this:
perf record -F 50 --call-graph dwarf ./my_prog arg1 arg2Notice the parameter -F 50. This means that profiler will take 50 samples per second. If your program runs quickly, increase the number to get more accurate information. On the other hand, if your program takes a lot of time to complete, decrease the number in order not to overload the system with irrelevant data.
When the command has finished running, in the directory where you ran the command you will see a file called perf.data which contains your profiling information. Flame Graphs use this file to generate that nice image.
To create a flame graph run:
perf script | /path/to/flamegraph/stackcollapse-perf.pl | /path/to/flamegraph/stackcollapse-recursive.pl | /path/to/flamegraph/flamegraph.pl > out.svgFile out.svg will contain the nice graph similar to the one from the beginning of this chapter.
Bonus: Script to generate FlameGraphs
If above process looks cumbersome, I wrote a bash script to help you with it. You can download the script here.
To run it, download it, open it and modify the variable PATH_TO_FLAMEGRAPHS to match the path on your computer. Here is an example on how to record the execution of ffmpeg from the above example using script:
./fg.sh -F 100 ./ffmpeg_g -y -i ../in.ts ../out.mkvWe want to generate flame graphs for command ./ffmpeg_g -y -i ../in.ts ../out-lto.mkv with fg.sh script. We want to specify 100 samples per second, so we provide -F 100 in the command line. This argument as well as all other arguments before the actual command are passed to perf.
Final Words
FlameGraphs are great tool to quickly see where your program is spending time and what functions have most potential to optimize.
As far as limitations are concerned, some of them are related to the representation: the stack backtraces on X axis are sorted alphabetically and merged if they are same and you cannot discern if there was one large call made to a function or several smaller calls. If there is a single functions called from many different locations in your program (like malloc), you will not be able to see this from the graph.
There are also limitations that are same as the limitations of the used profiler, in case of perf this includes that some short functions might miss from the profiler output or that the data is slightly skewed in case sample frequency is low.
Nevertheless, I think this is a great tool and it should be the first tool to use when trying to figure out why your program is slow.
Do you need to discuss a performance problem in your project? Or maybe you want a vectorization training for yourself or your team? Contact us
You can also subscribe to our mailing list (link top right of this page) or follow us on LinkedIn , Twitter or Mastodon and get notified as soon as new content becomes available.
- ffmpeg is a software used to manipulate audio and video streams [↩]